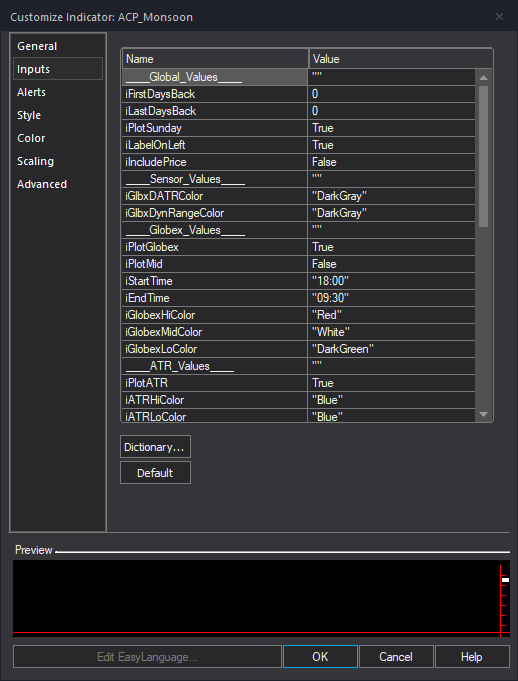
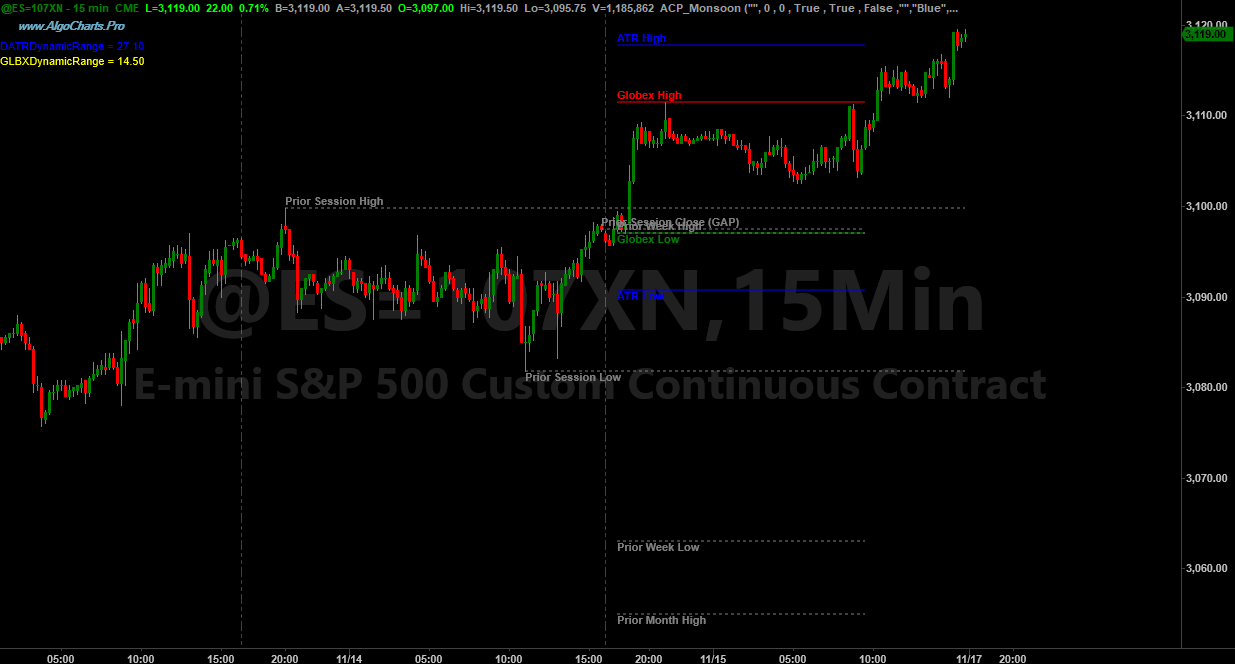
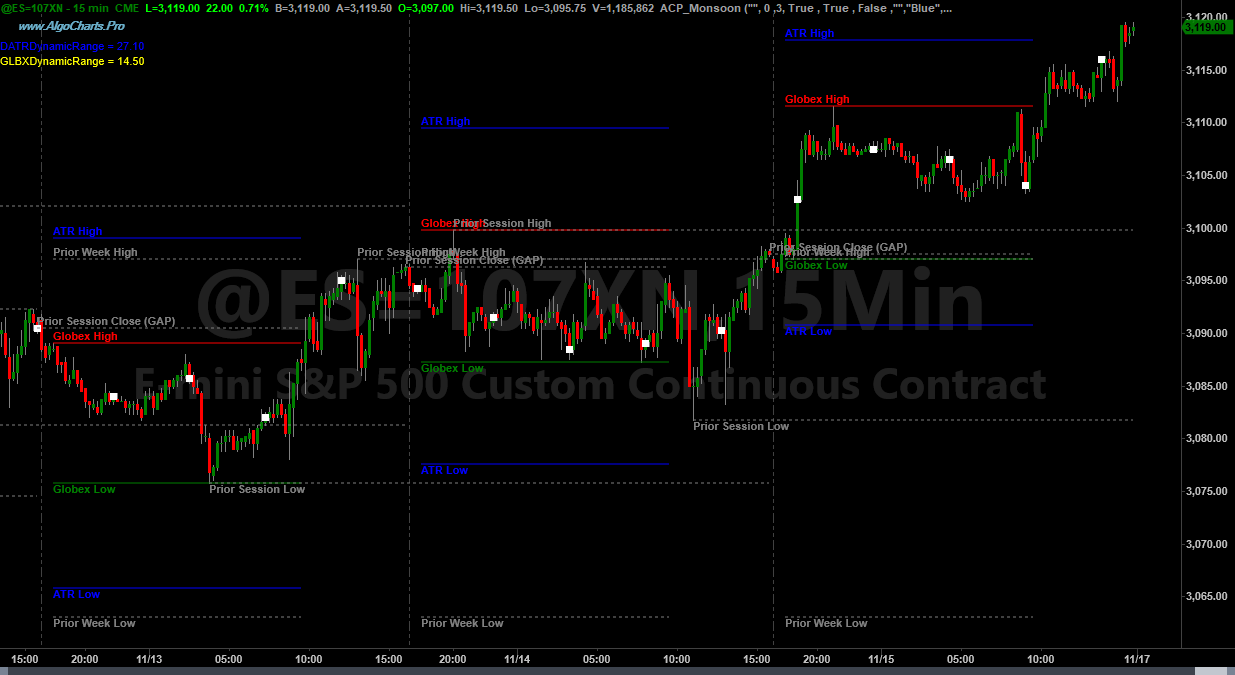
Monsoon was created to replicate Jeff Manson's Pre-Market morning analysis. The key to success is knowing where powerful key reversal points exists and identify them quickly. This study plots the prior session high/low/close, Globex high/low, Daily ATR high/low, Monthly/Weekly high/low, and daily US Pit open/close.
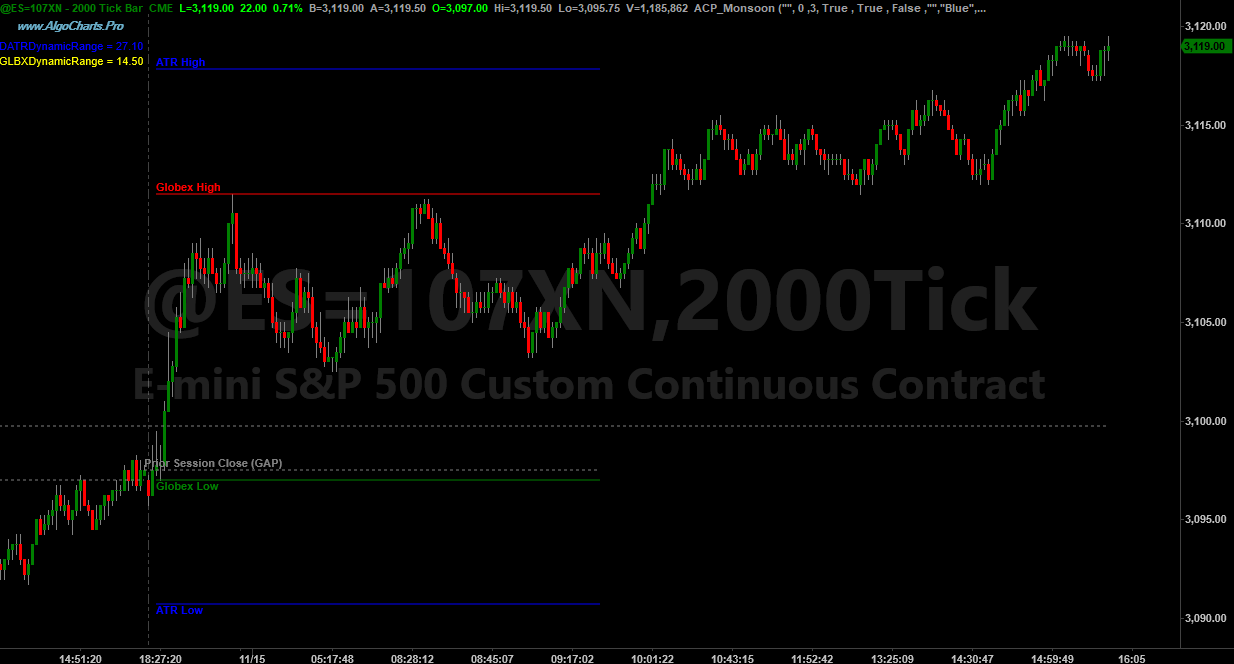
The Real-Time Dynamic Range Sensors can be used to instantly see the potential Globex & Daily ATR daily momentum. Often traders rely on this information to determine market sentiment and also to use as open order targets. If the Dynamic Globex and Daily ATR are below average, the intraday trader can be aware to take profits more aggressively.
Monsoon has been designed to provide quick access to Real-Time Globex Highs & Lows while providing the Daily ATR High & Low swings as new Globex highs and lows are formed. This methodology has been adapted from Dawn Dawson’s teachings on Globex values and 10 day Average True Range.
Quickly harness the power of knowing where Monthly, Weekly, & Daily High/Lows exist coupled with US Pit Open/Close.
Monsoon has been coded using advanced Object Orientated coding methodologies providing robust performance results predominantly leading to less CPU & Memory consumption and Memory leaks. You can be assured that all our coding efforts are tailored for CPU & Memory concerns from the onset.
Monsoon Article
Risk
Disclaimer
STANDARD
$29.991 Month License
- Unlimited Usage
- Unlimited Version Release
- Source Code NOT Included
- Ownership NOT Included
- Discounts Unavailable
PREMIUM
$239.991 Year License
- Unlimited Usage
- Unlimited Version Release
- Source Code NOT Included
- Ownership NOT Included
- Discounts Available
ULTIMATE
$479.992 Year License
- Unlimited Usage
- Unlimited Version Release
- Source Code NOT Included
- Ownership NOT Included
- Discounts Available
Discount Incentives: We offer Student & Military Discounts for PREMIUM & ULTIMATE Licenses only. Please Contact Us for an individual invoice.
DISCLAIMER
Algo Chart Pro is a software company. We are not in the business of providing financial or investment advice, nor are we registered with the proper authorities to do so. The product we provide (both the software and its associated documentation, examples, etc.) is for educational purposes only and should never be construed as providing trading or investment recommendations or advice. Any decisions you make using this product are made at your own risk and are yours and yours alone. Remember that trading is inherently risky, and traders may sustain losses greater than their investments regardless of which asset classes are traded. Before trading, carefully consider the risks involved in light of your financial condition and never trade money you can't afford to lose.
Required US Government Disclaimers: Futures and Options trading has large potential rewards, but also large potential risk. You must be aware of the risks and be willing to accept them in order to invest in the futures and options markets. Don't trade with money you can't afford to lose. This is neither a solicitation nor an offer to Buy/Sell futures or options. No representation is being made that any account will or is likely to achieve profits or losses similar to those discussed here. The past performance of any trading system or methodology is not necessarily indicative of future results.
CFTC RULE 4.41 - HYPOTHETICAL OR SIMULATED PERFORMANCE RESULTS HAVE CERTAIN INHERENT LIMITATIONS. UNLIKE AN ACTUAL PERFORMANCE RECORD, SIMULATED RESULTS DO NOT REPRESENT ACTUAL TRADING. ALSO, SINCE THE TRADES HAVE NOT BEEN ACTUALLY EXECUTED, THE RESULTS MAY HAVE UNDER-OR-OVER COMPENSATED FOR THE IMPACT, IF ANY, OF CERTAIN MARKET FACTORS, SUCH AS LACK OF LIQUIDITY. SIMULATED TRADING PROGRAMS IN GENERAL ARE ALSO SUBJECT TO THE FACT THAT THEY ARE DESIGNED WITH THE BENEFIT OF HINDSIGHT. NO REPRESENTATION IS BEING MADE THAT ANY ACCOUNT WILL OR IS LIKELY TO ACHIEVE PROFIT OR LOSSES SIMILAR TO THOSE SHOWN.